Client
Fortum
Agency
Futurice
Year
2016
My Role
UX Design
UI Design
Visual Design
Interaction Design
Data Visualization
UI Design
Visual Design
Interaction Design
Data Visualization
About the Project
Apollo is a forecasting tool that runs the optimizations automatically, unlike the old, manual hydro optimization process Apollo models a horizon that ranges from one to several years. This allows Fortum to spend more time on analyzing the actual results rather than creating them.
Challenges
In 2015, Fortum began using a new stochastic model to optimize the production of hydropower in the medium term. The improved optimization model produces a staggering volume of data and required a completely new way of presenting the results.
One optimization may involve tens of thousands of different time series. The data model includes the asset models with time series attributes describing, for example, input data required for optimizations and optimization results.
One optimization may involve tens of thousands of different time series. The data model includes the asset models with time series attributes describing, for example, input data required for optimizations and optimization results.
Approach
The collaboration with Fortum started with a vision project, where our team explored both the user and business needs, followed by co-creating a vision and set of features meeting all the user expectations.
Feedback is one of the most important inputs in a user-centered project like Apollo. We gathered ideas from end users and discussed those with them in order to understand the “why” and the need behind them. All the designs were shown and discussed with the end users to make sure the system is not adding any additional cognitive load.
Feedback is one of the most important inputs in a user-centered project like Apollo. We gathered ideas from end users and discussed those with them in order to understand the “why” and the need behind them. All the designs were shown and discussed with the end users to make sure the system is not adding any additional cognitive load.
Key features
Apollo is an expert system that requires a lot of flexibility for the end-user - i.e. all the bells and whistles potentially available.
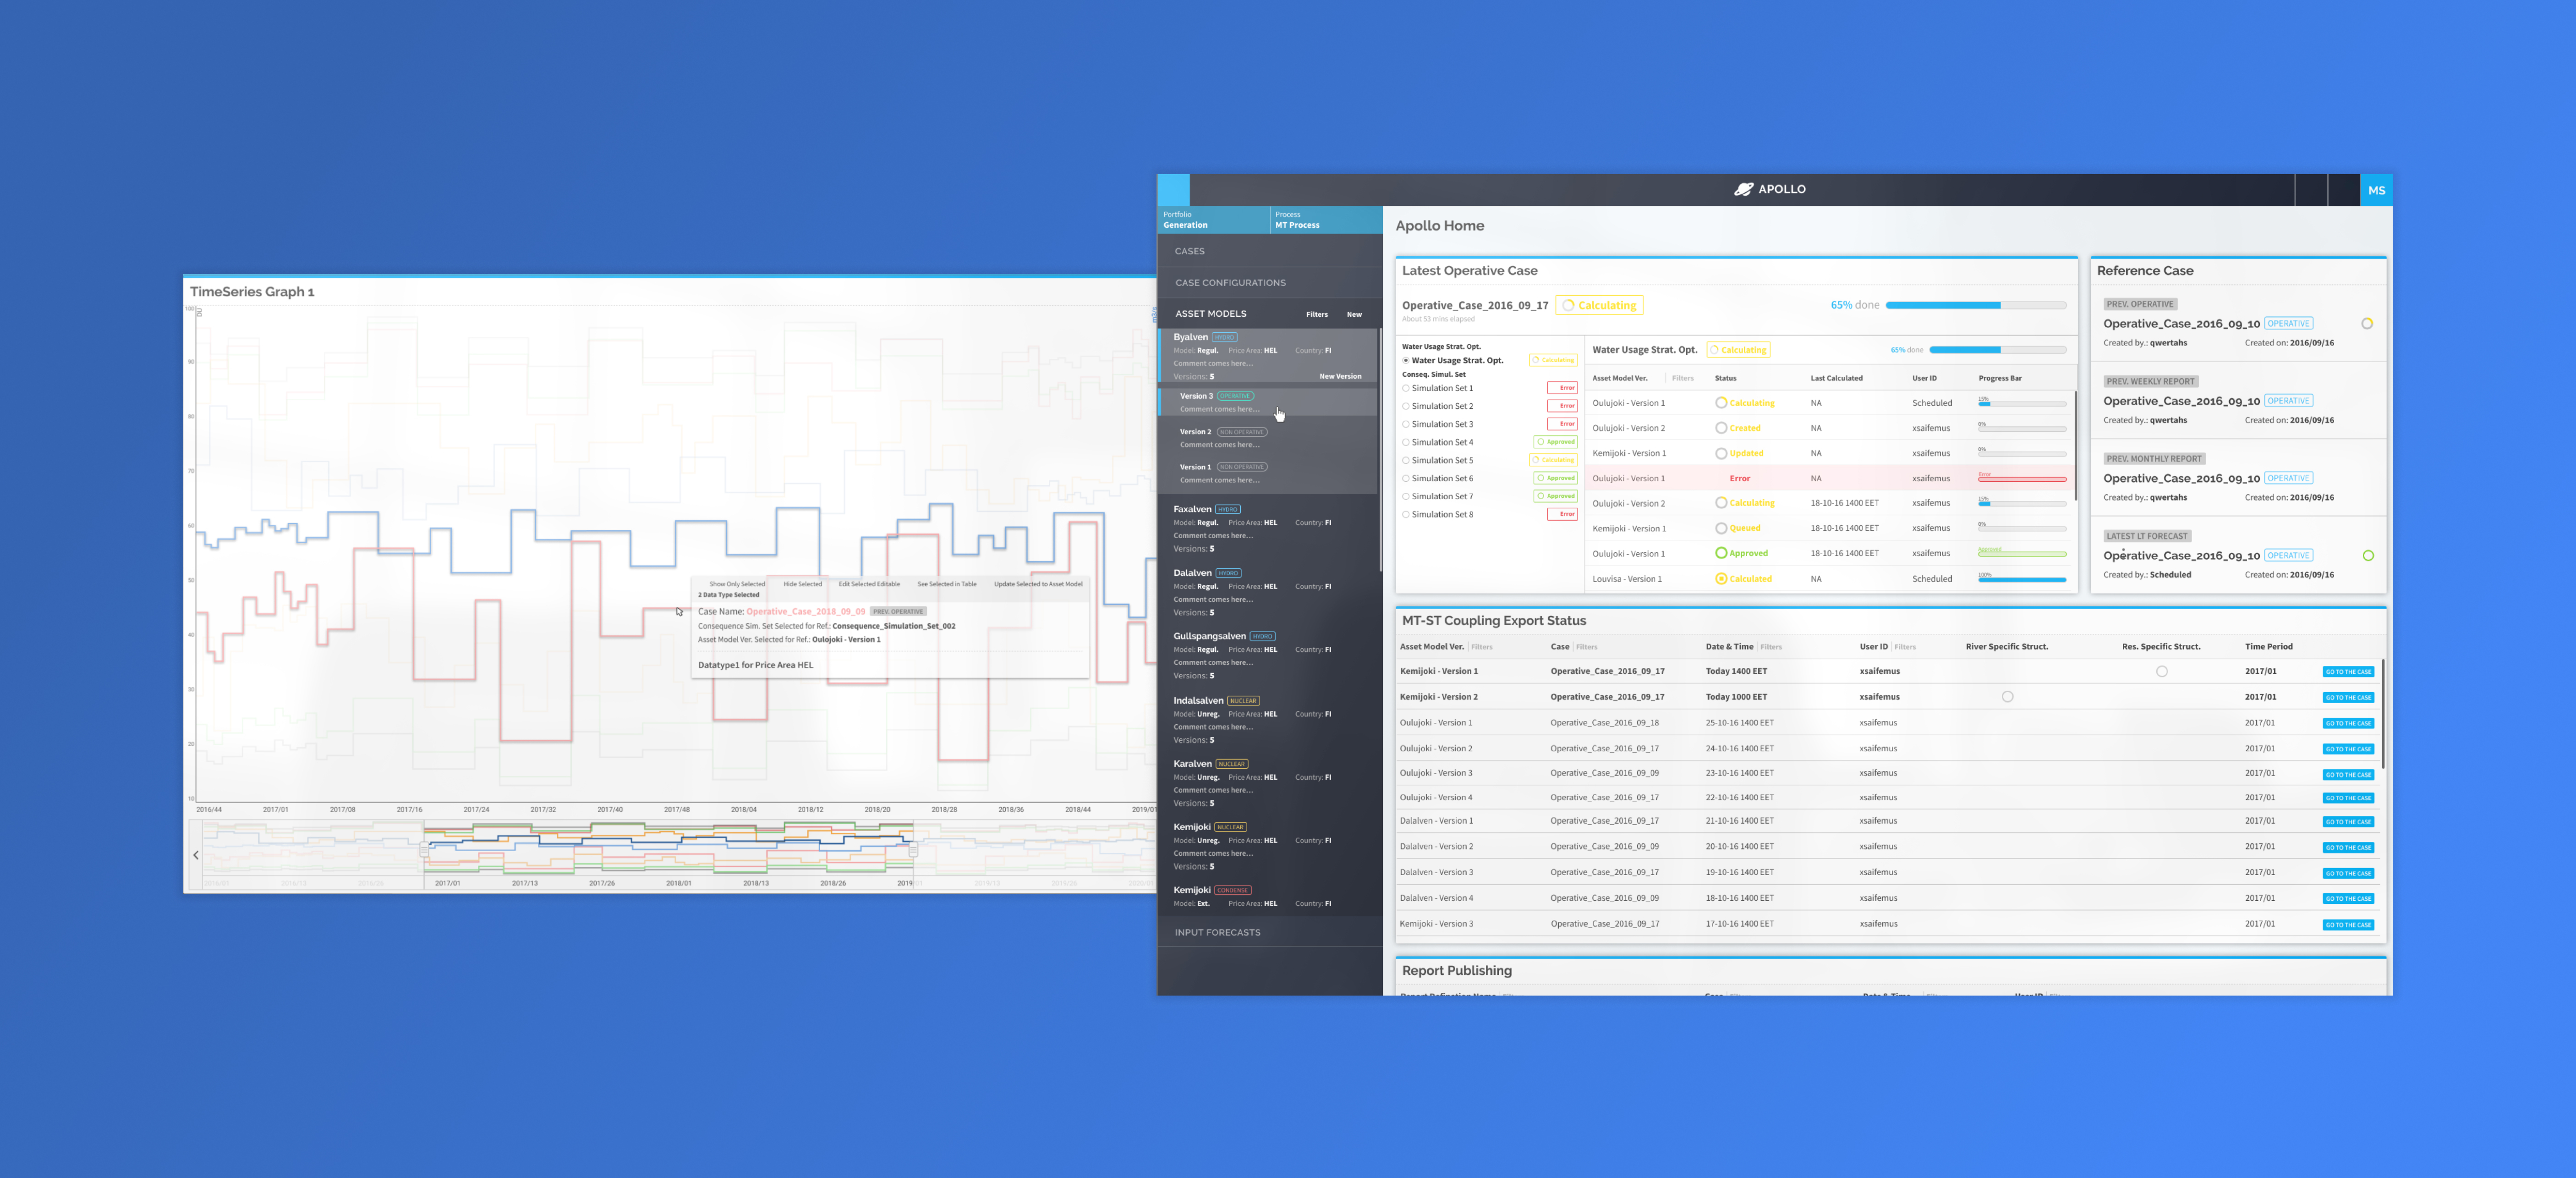
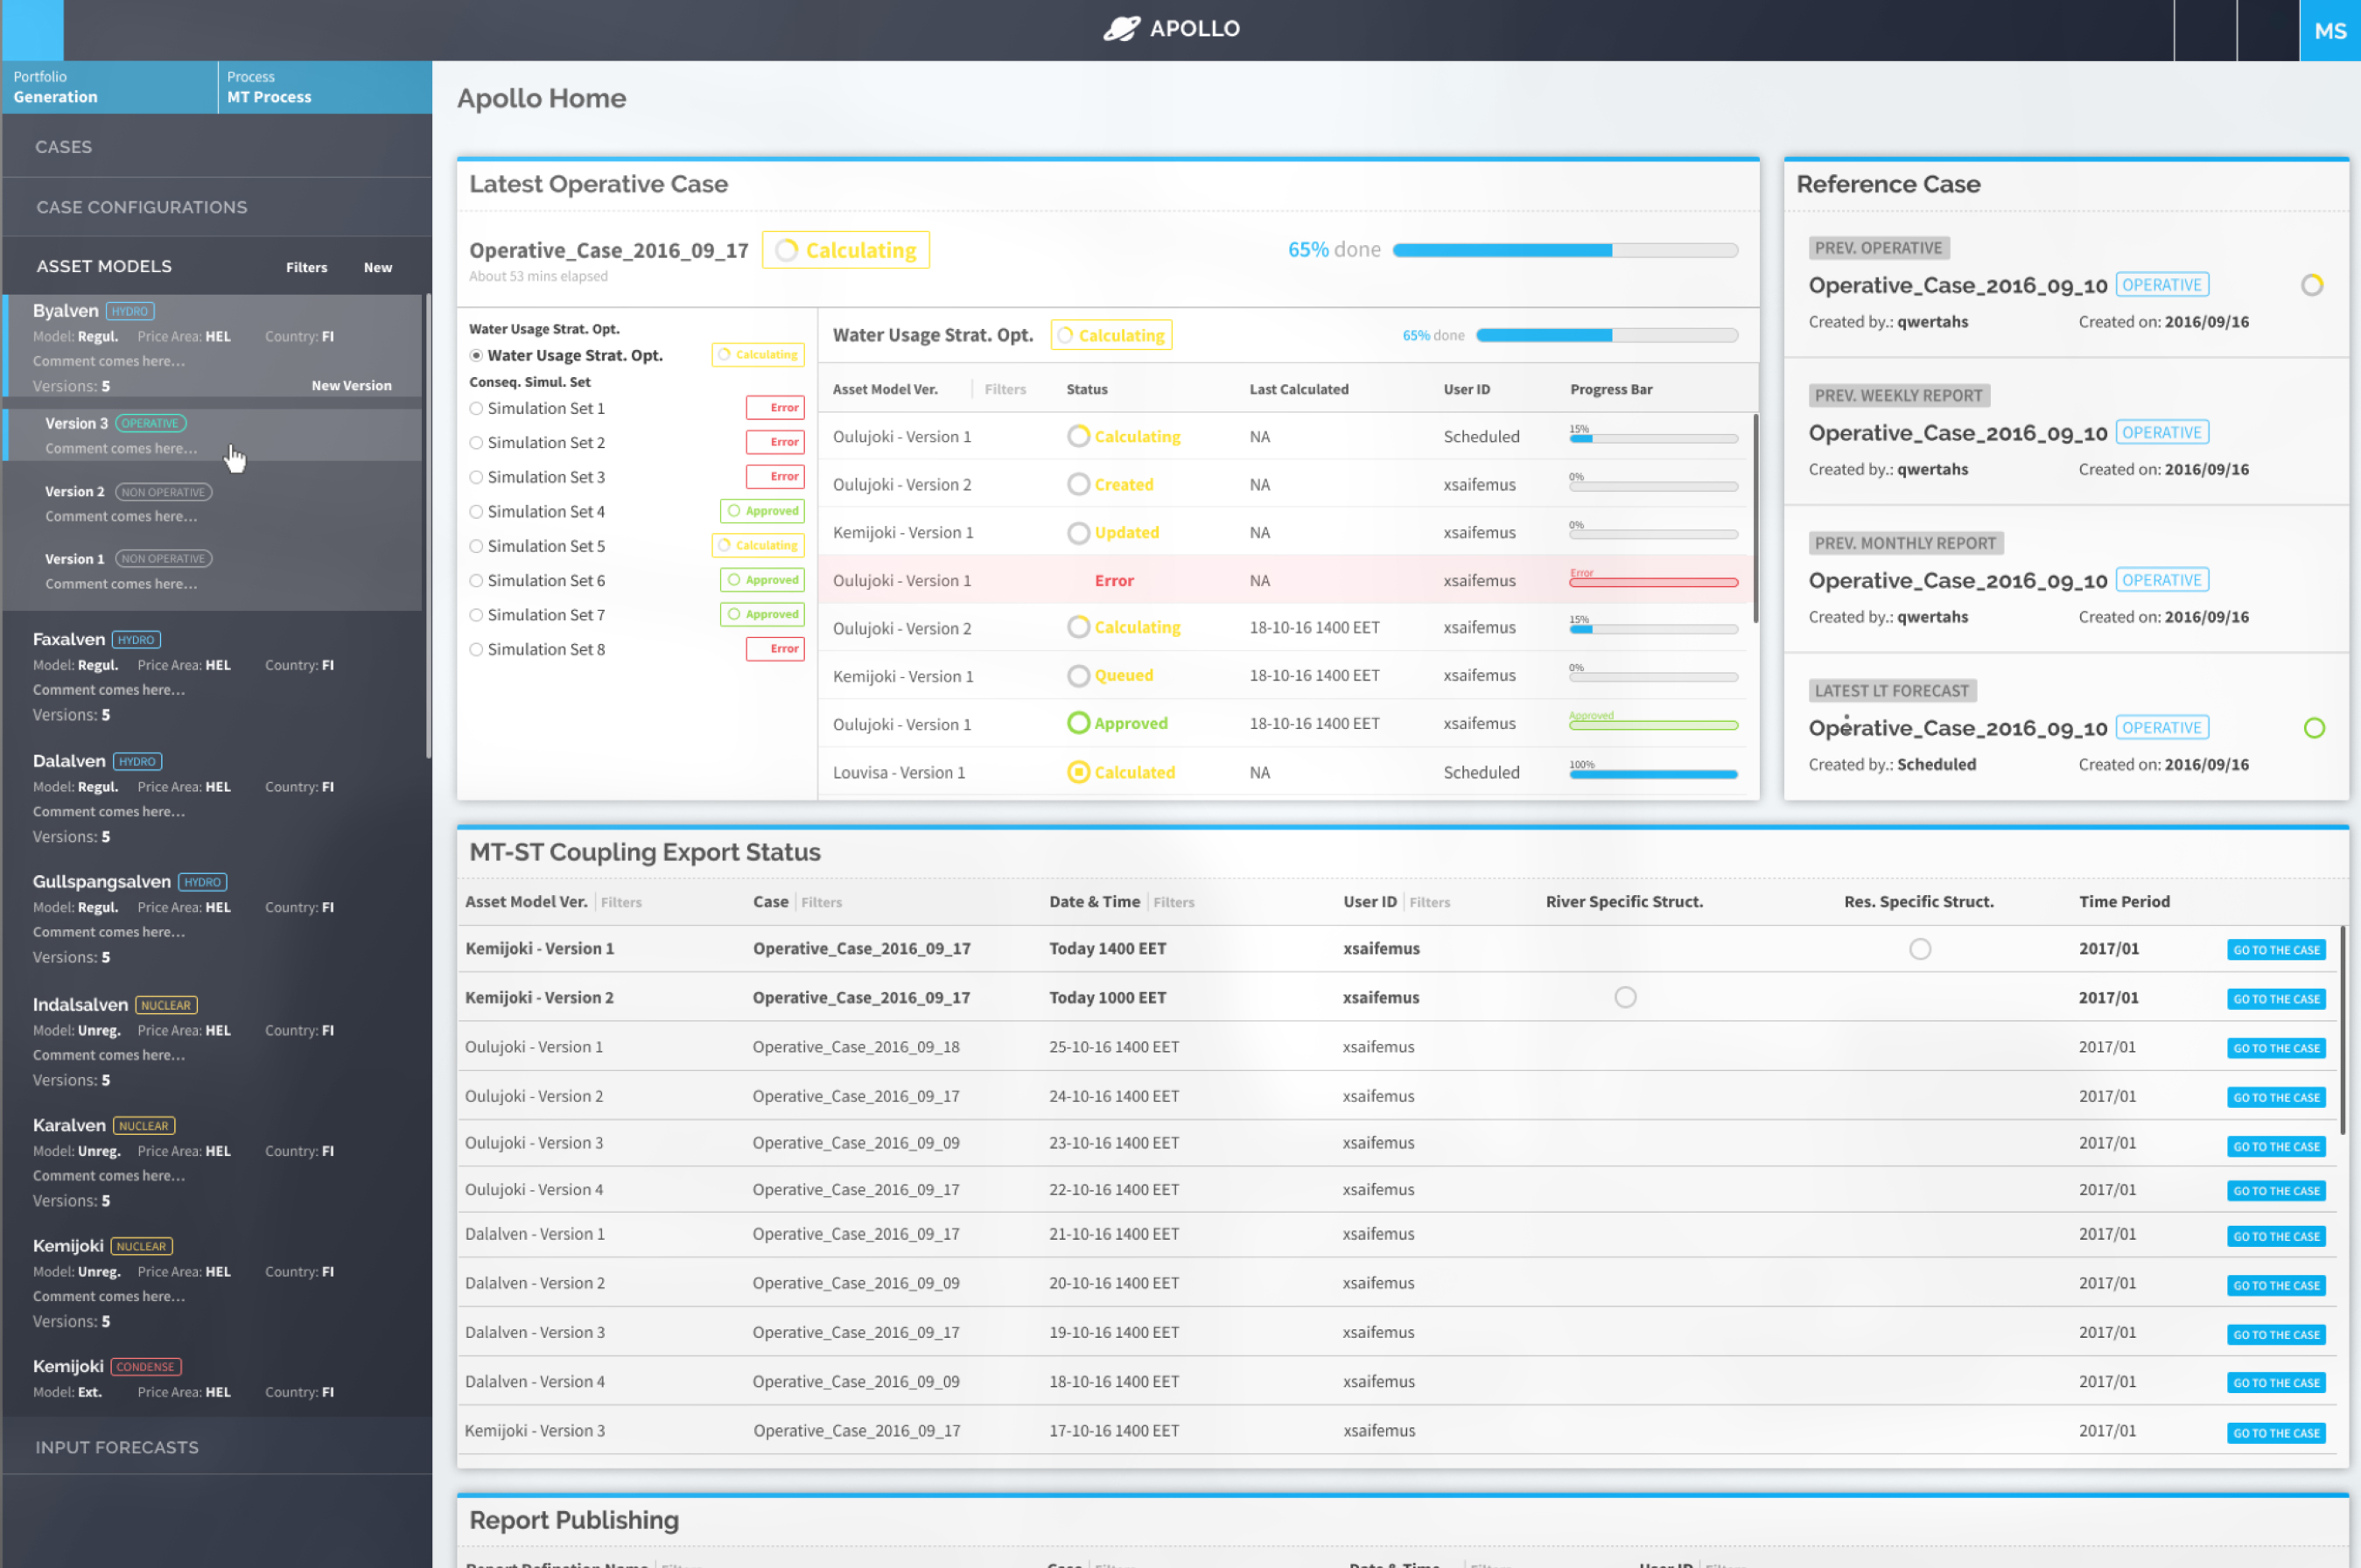
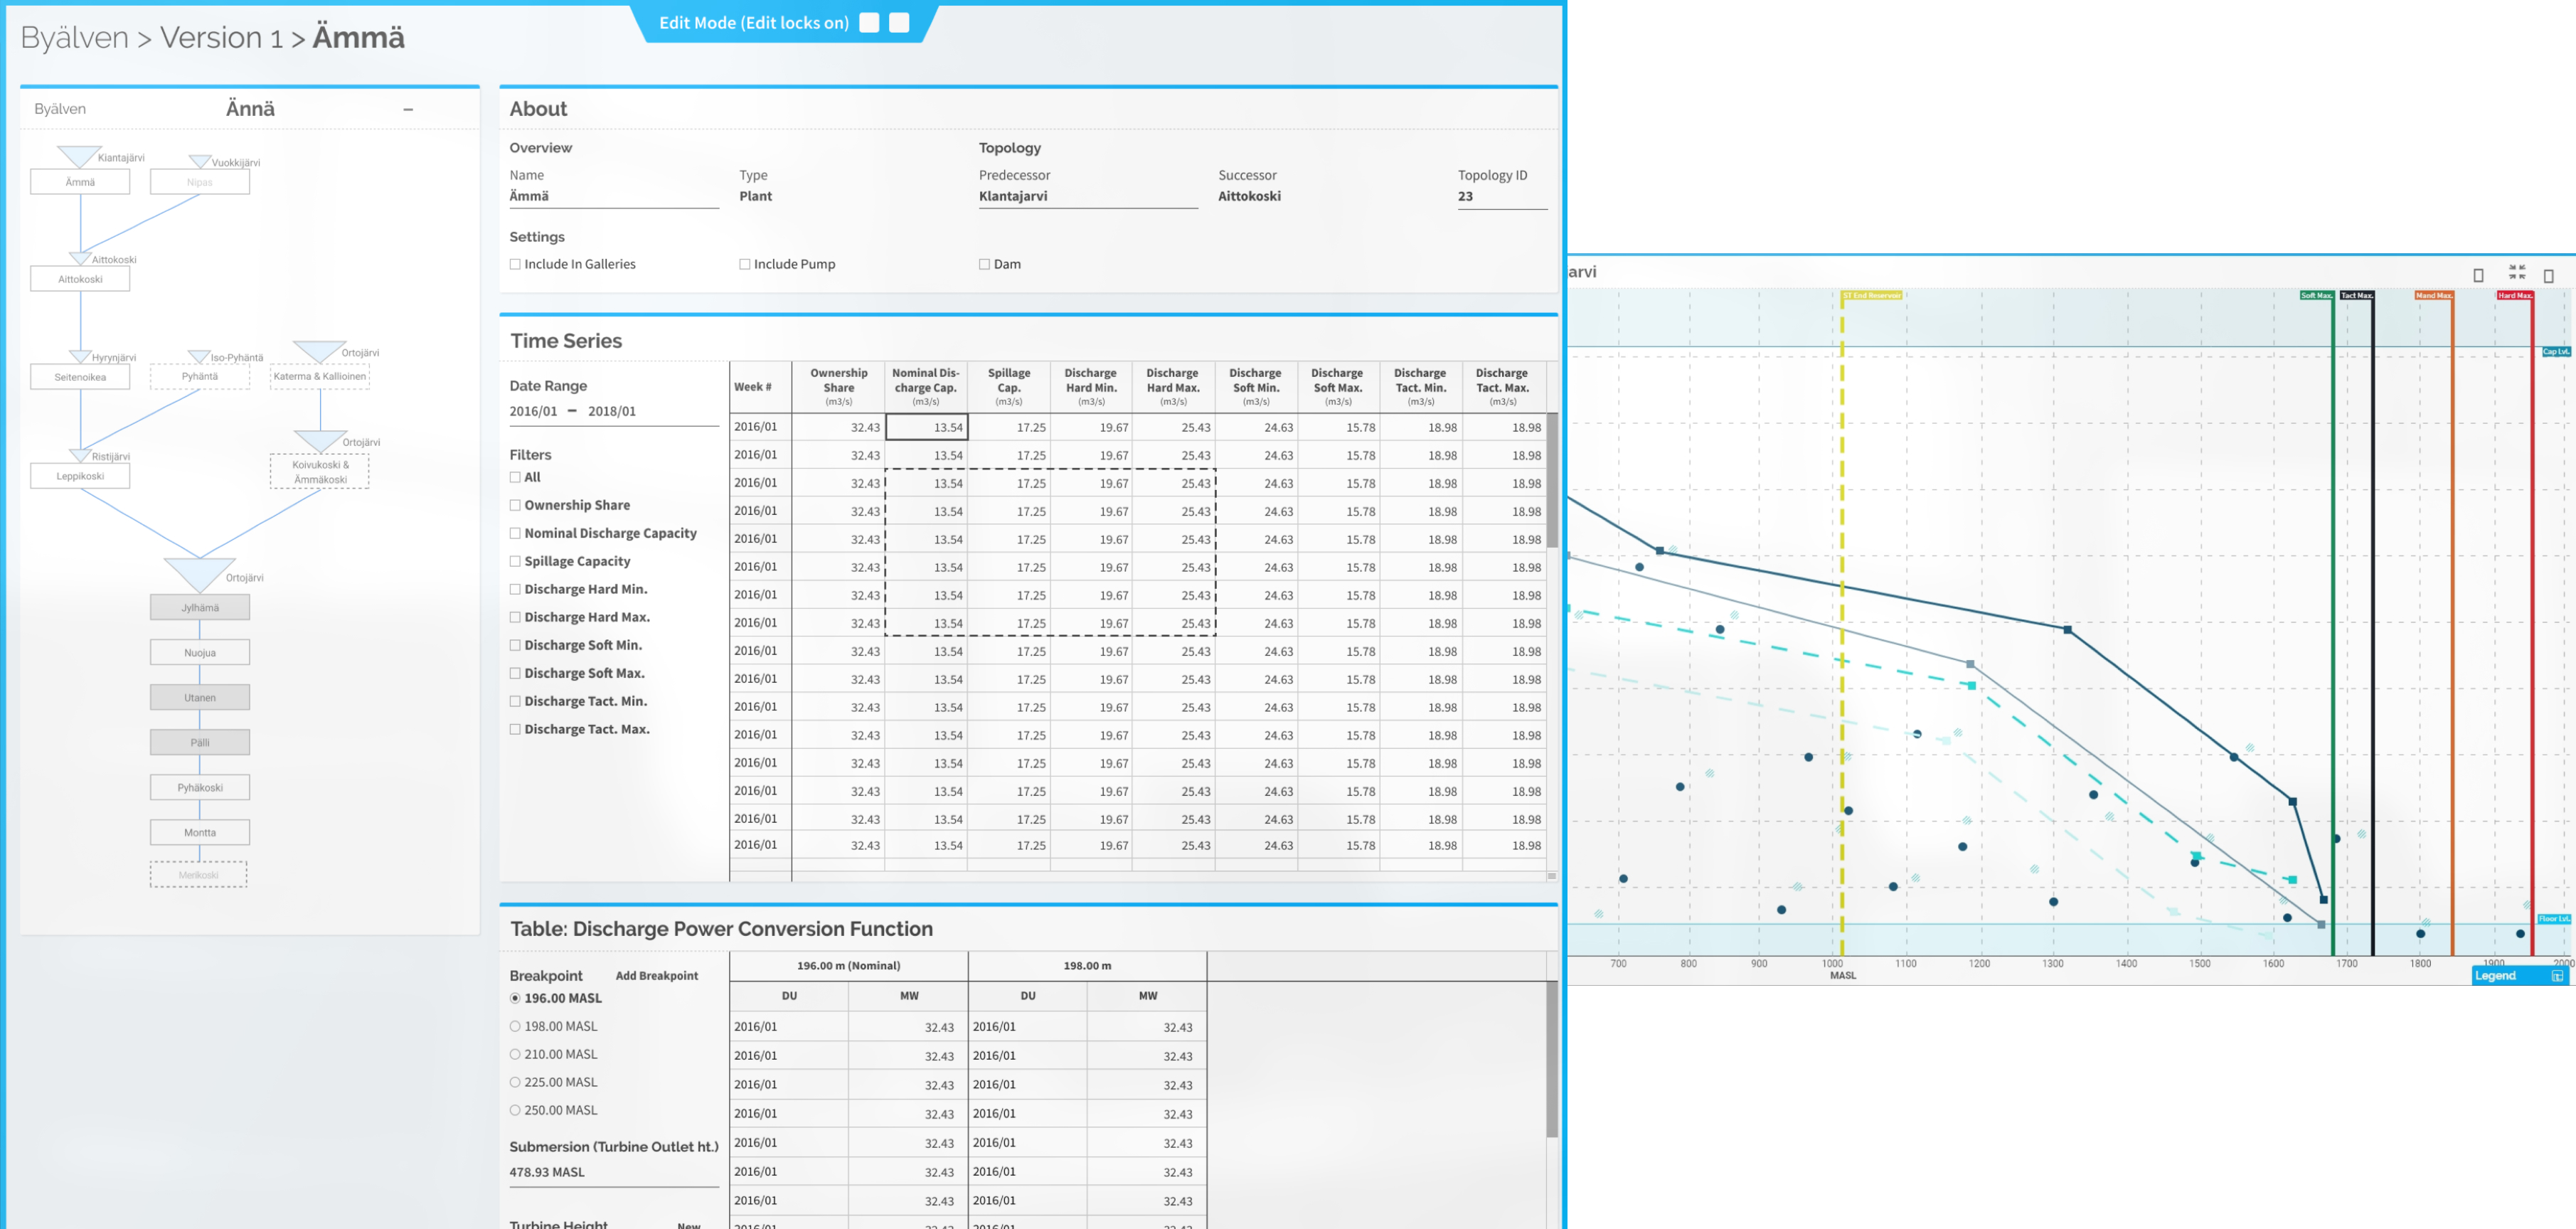
Creation of Optimization
The basic process for creating operative optimization requires creating a snapshot of the inputs, running the optimizations, and generating predefined reports. This is a cumbersome task and requires a lot of input from the user.
To reduce the load on the users the system lets the user automate the process based on pre-defined templates.
To reduce the load on the users the system lets the user automate the process based on pre-defined templates.
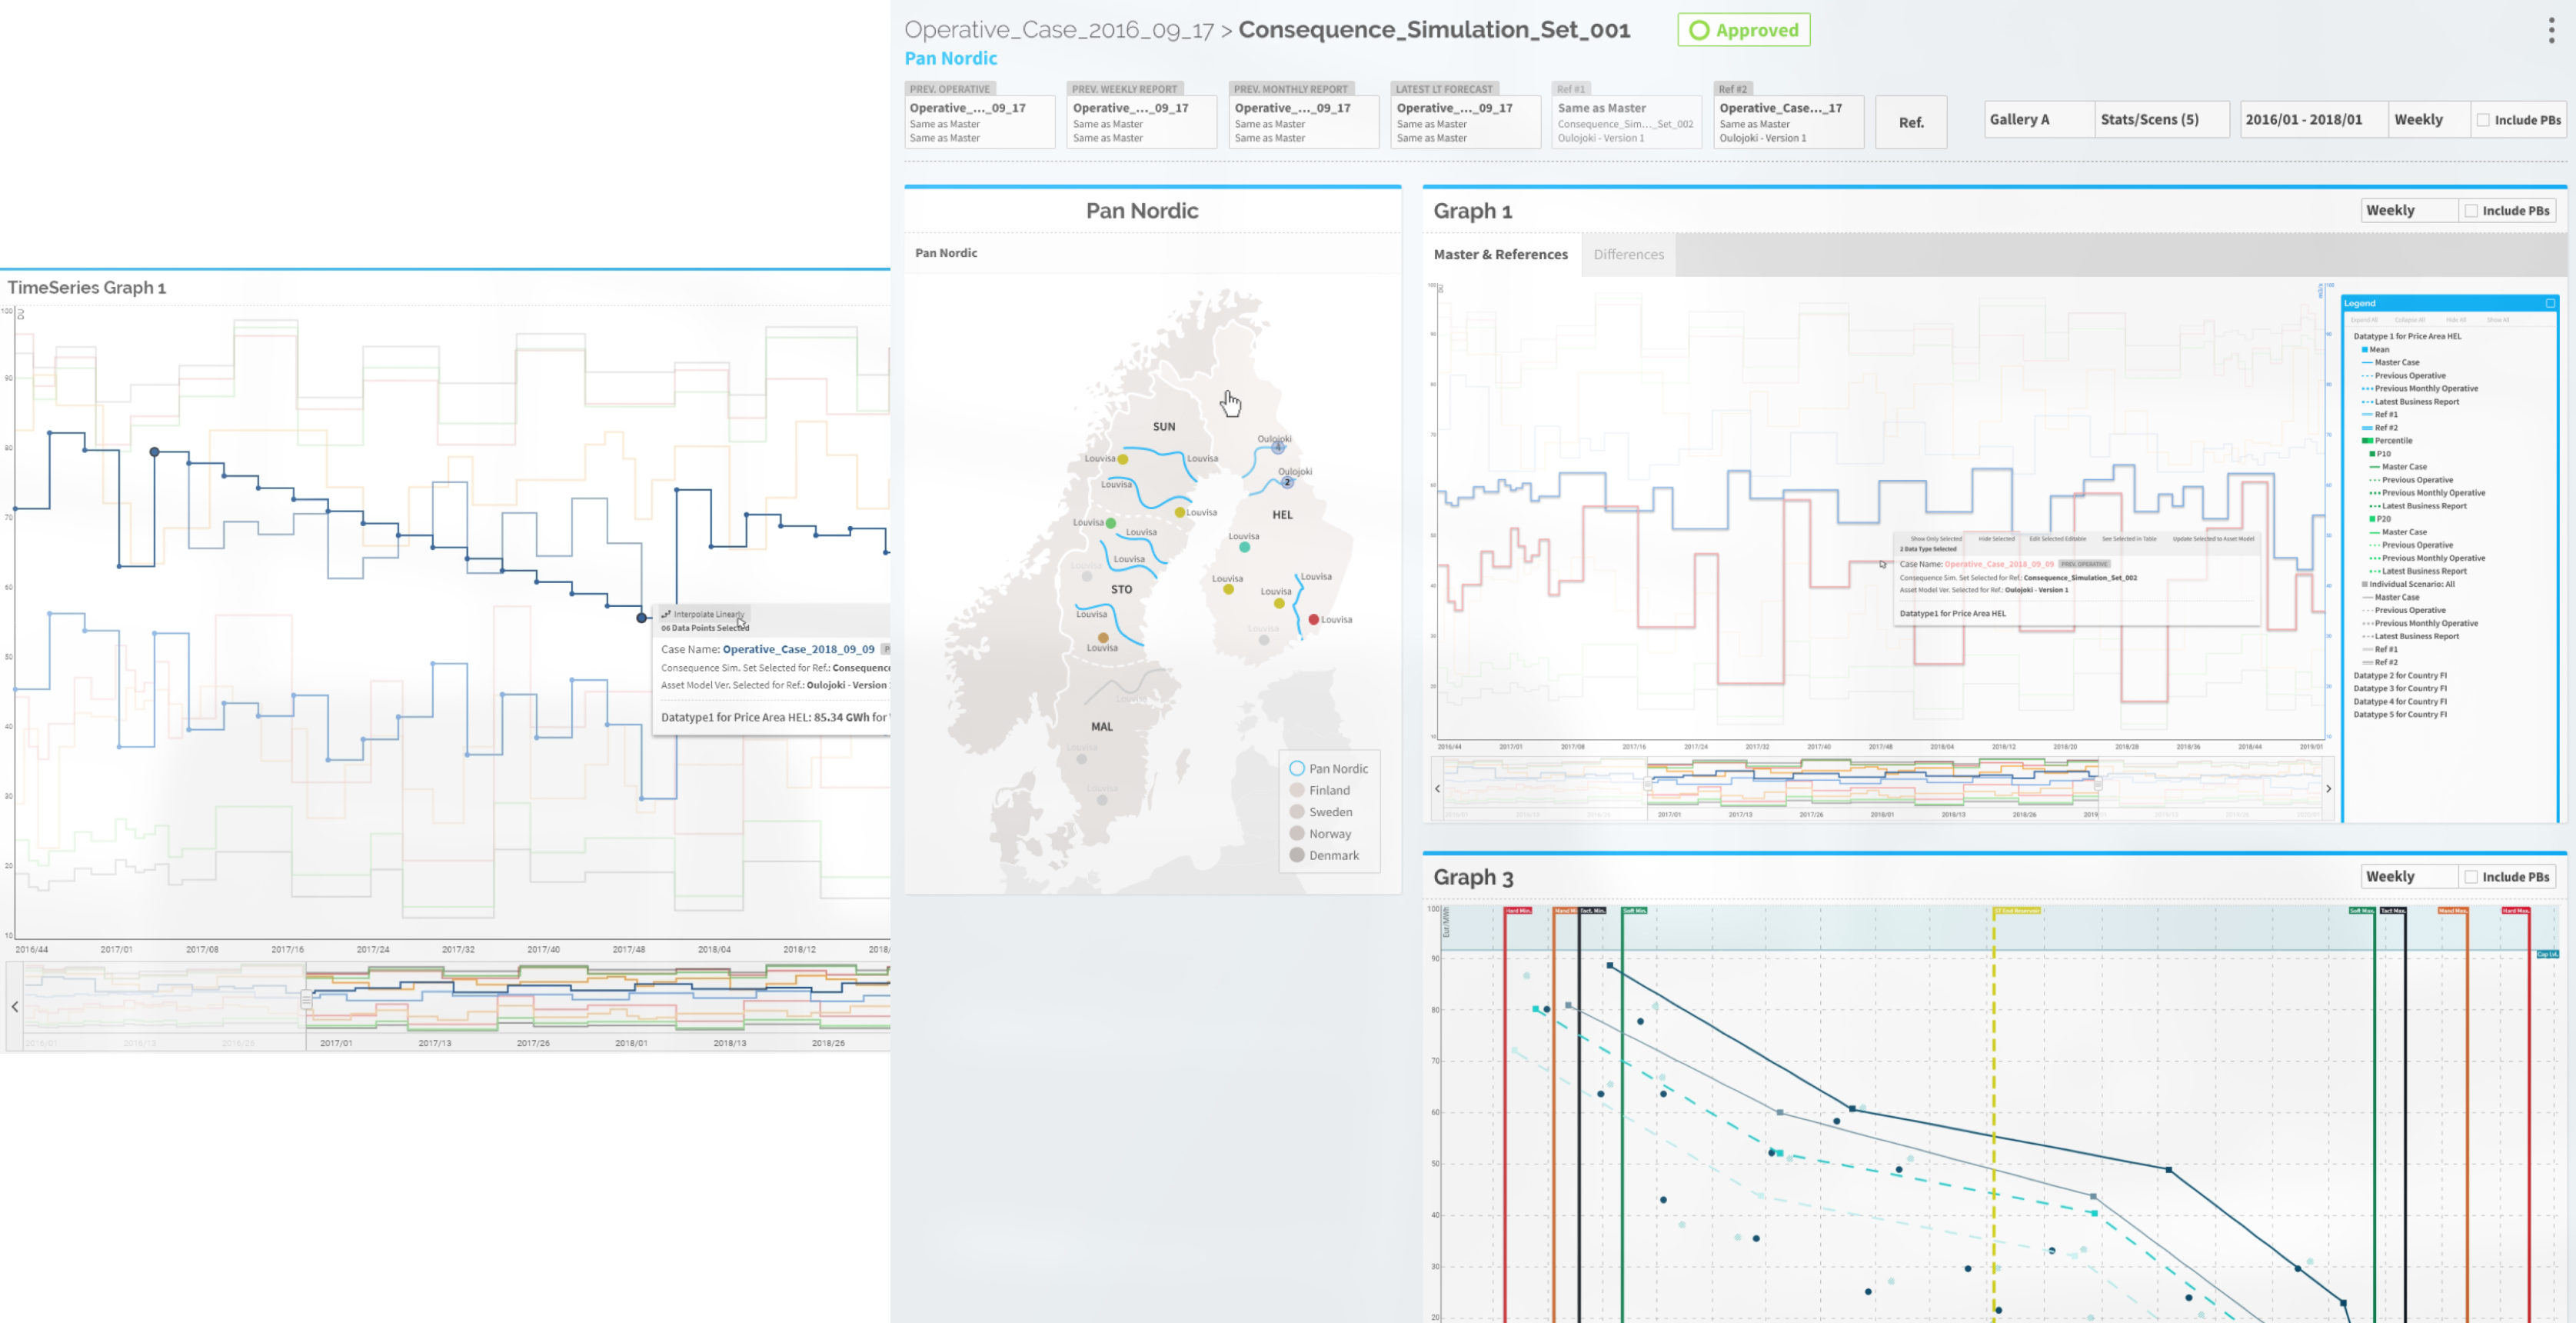
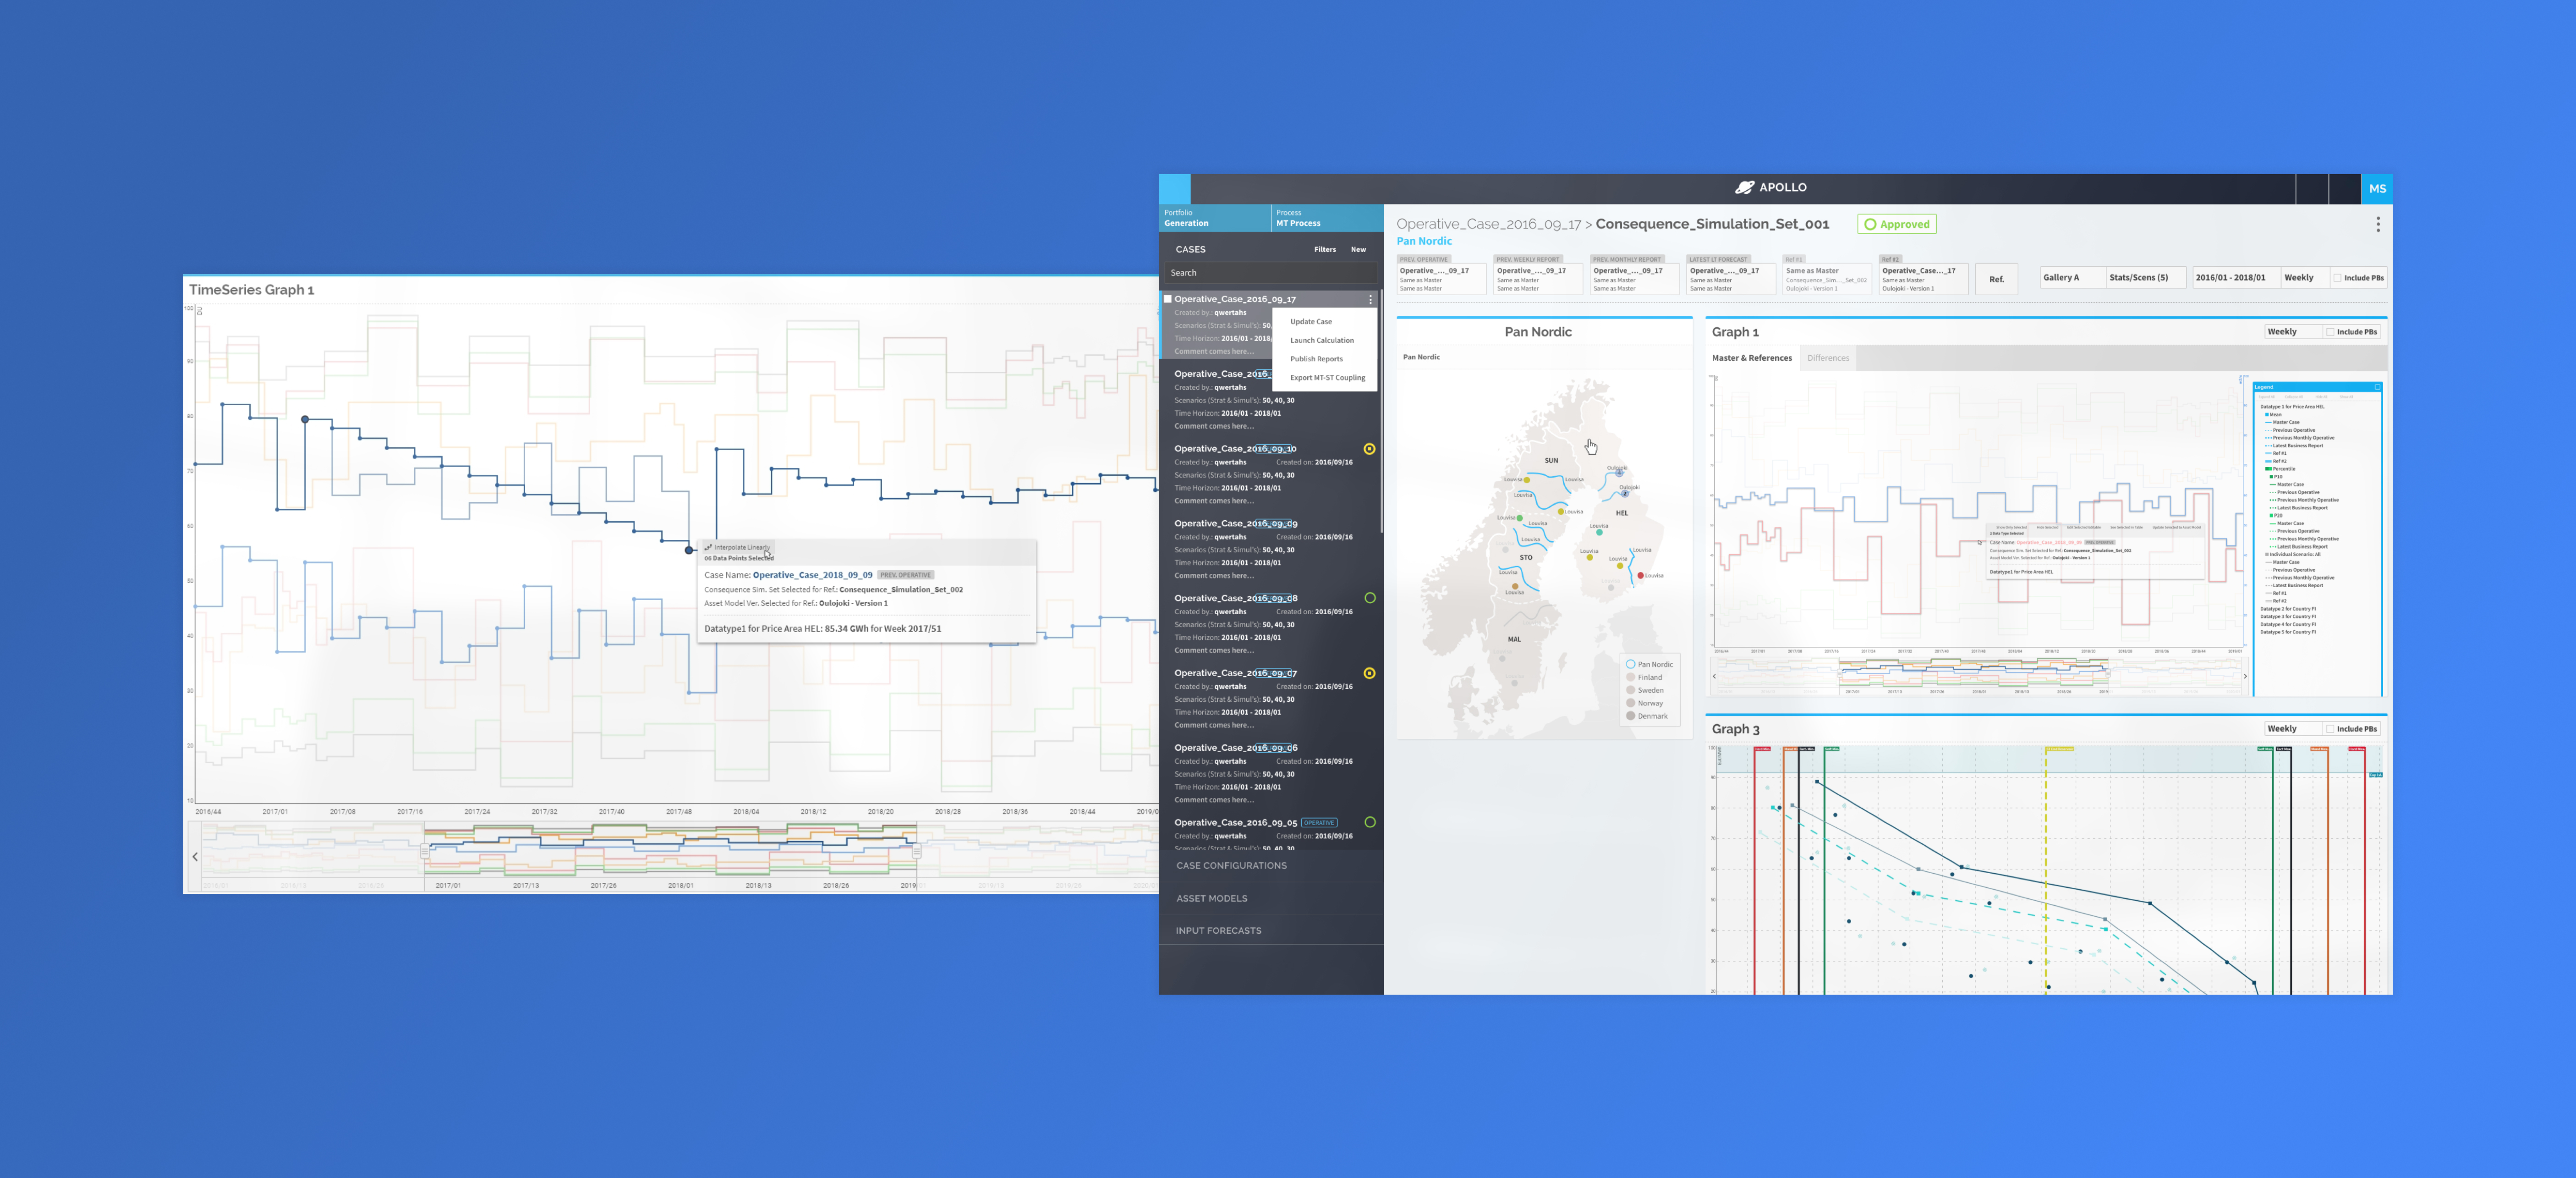
Visualize the Result of the Optimizations
The data model for Apollo is very complex. One optimization may involve tens of thousands of different time series. There is a need to analyze different combinations of time series and results, different detail levels of the results, for different asset models and their combinations, and so on.
For this purpose, a domain-specific visual templating language was created, which makes it theoretically possible to create an endless number of different visualizations.
For this purpose, a domain-specific visual templating language was created, which makes it theoretically possible to create an endless number of different visualizations.
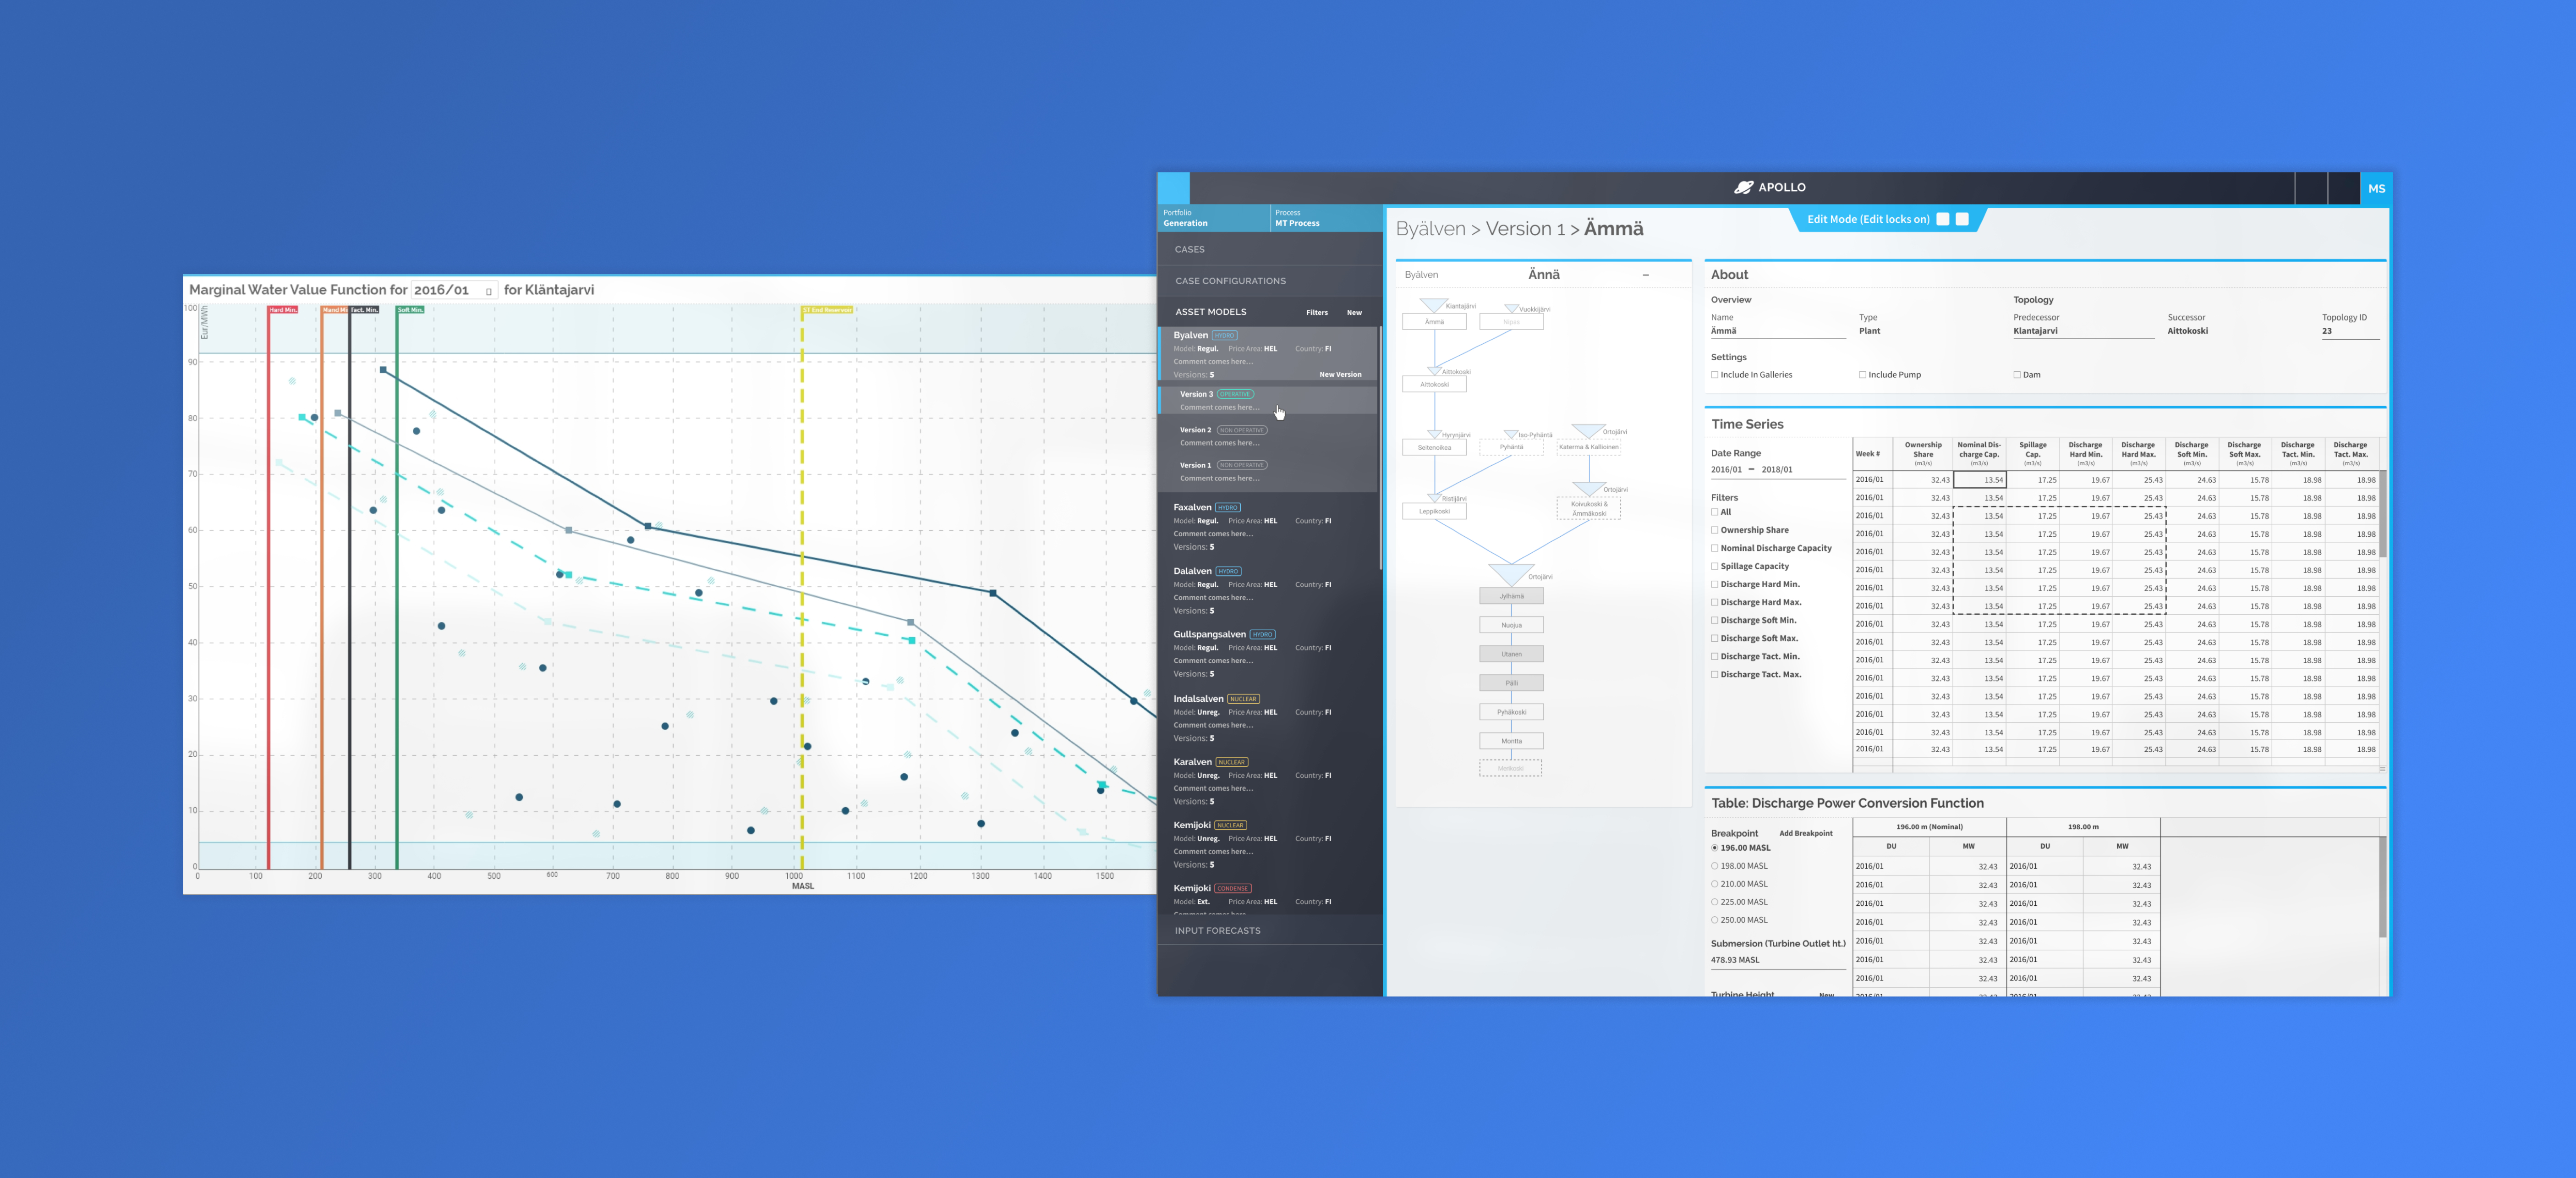
Analyze the Result
The user is provided with an intuitively understandable view of the resulting scenarios, both via the visualization tool used to create interactive charts and tables for the browser. This lets user do some basic analysis in the system itself. For deeper analysis the system lets the user download data in different formats like excel.
Results
There was significant reduction in human errors because of process automation. This also led to users have much more time to analyze the results and make more kinds of different analyses.
New users are able to get started with only a brief introduction because of the visual and simplified UI.
According to the product owner from Fortum the mid-term horizon hydropower forecasts and pricing of water have notably better quality after the implementation of the system.
New users are able to get started with only a brief introduction because of the visual and simplified UI.
According to the product owner from Fortum the mid-term horizon hydropower forecasts and pricing of water have notably better quality after the implementation of the system.